Resilience and fragmentation in healthcare coalitions: The link between resource contributions and centrality in health-related interorganizational networks


New article first published online: Social Networks

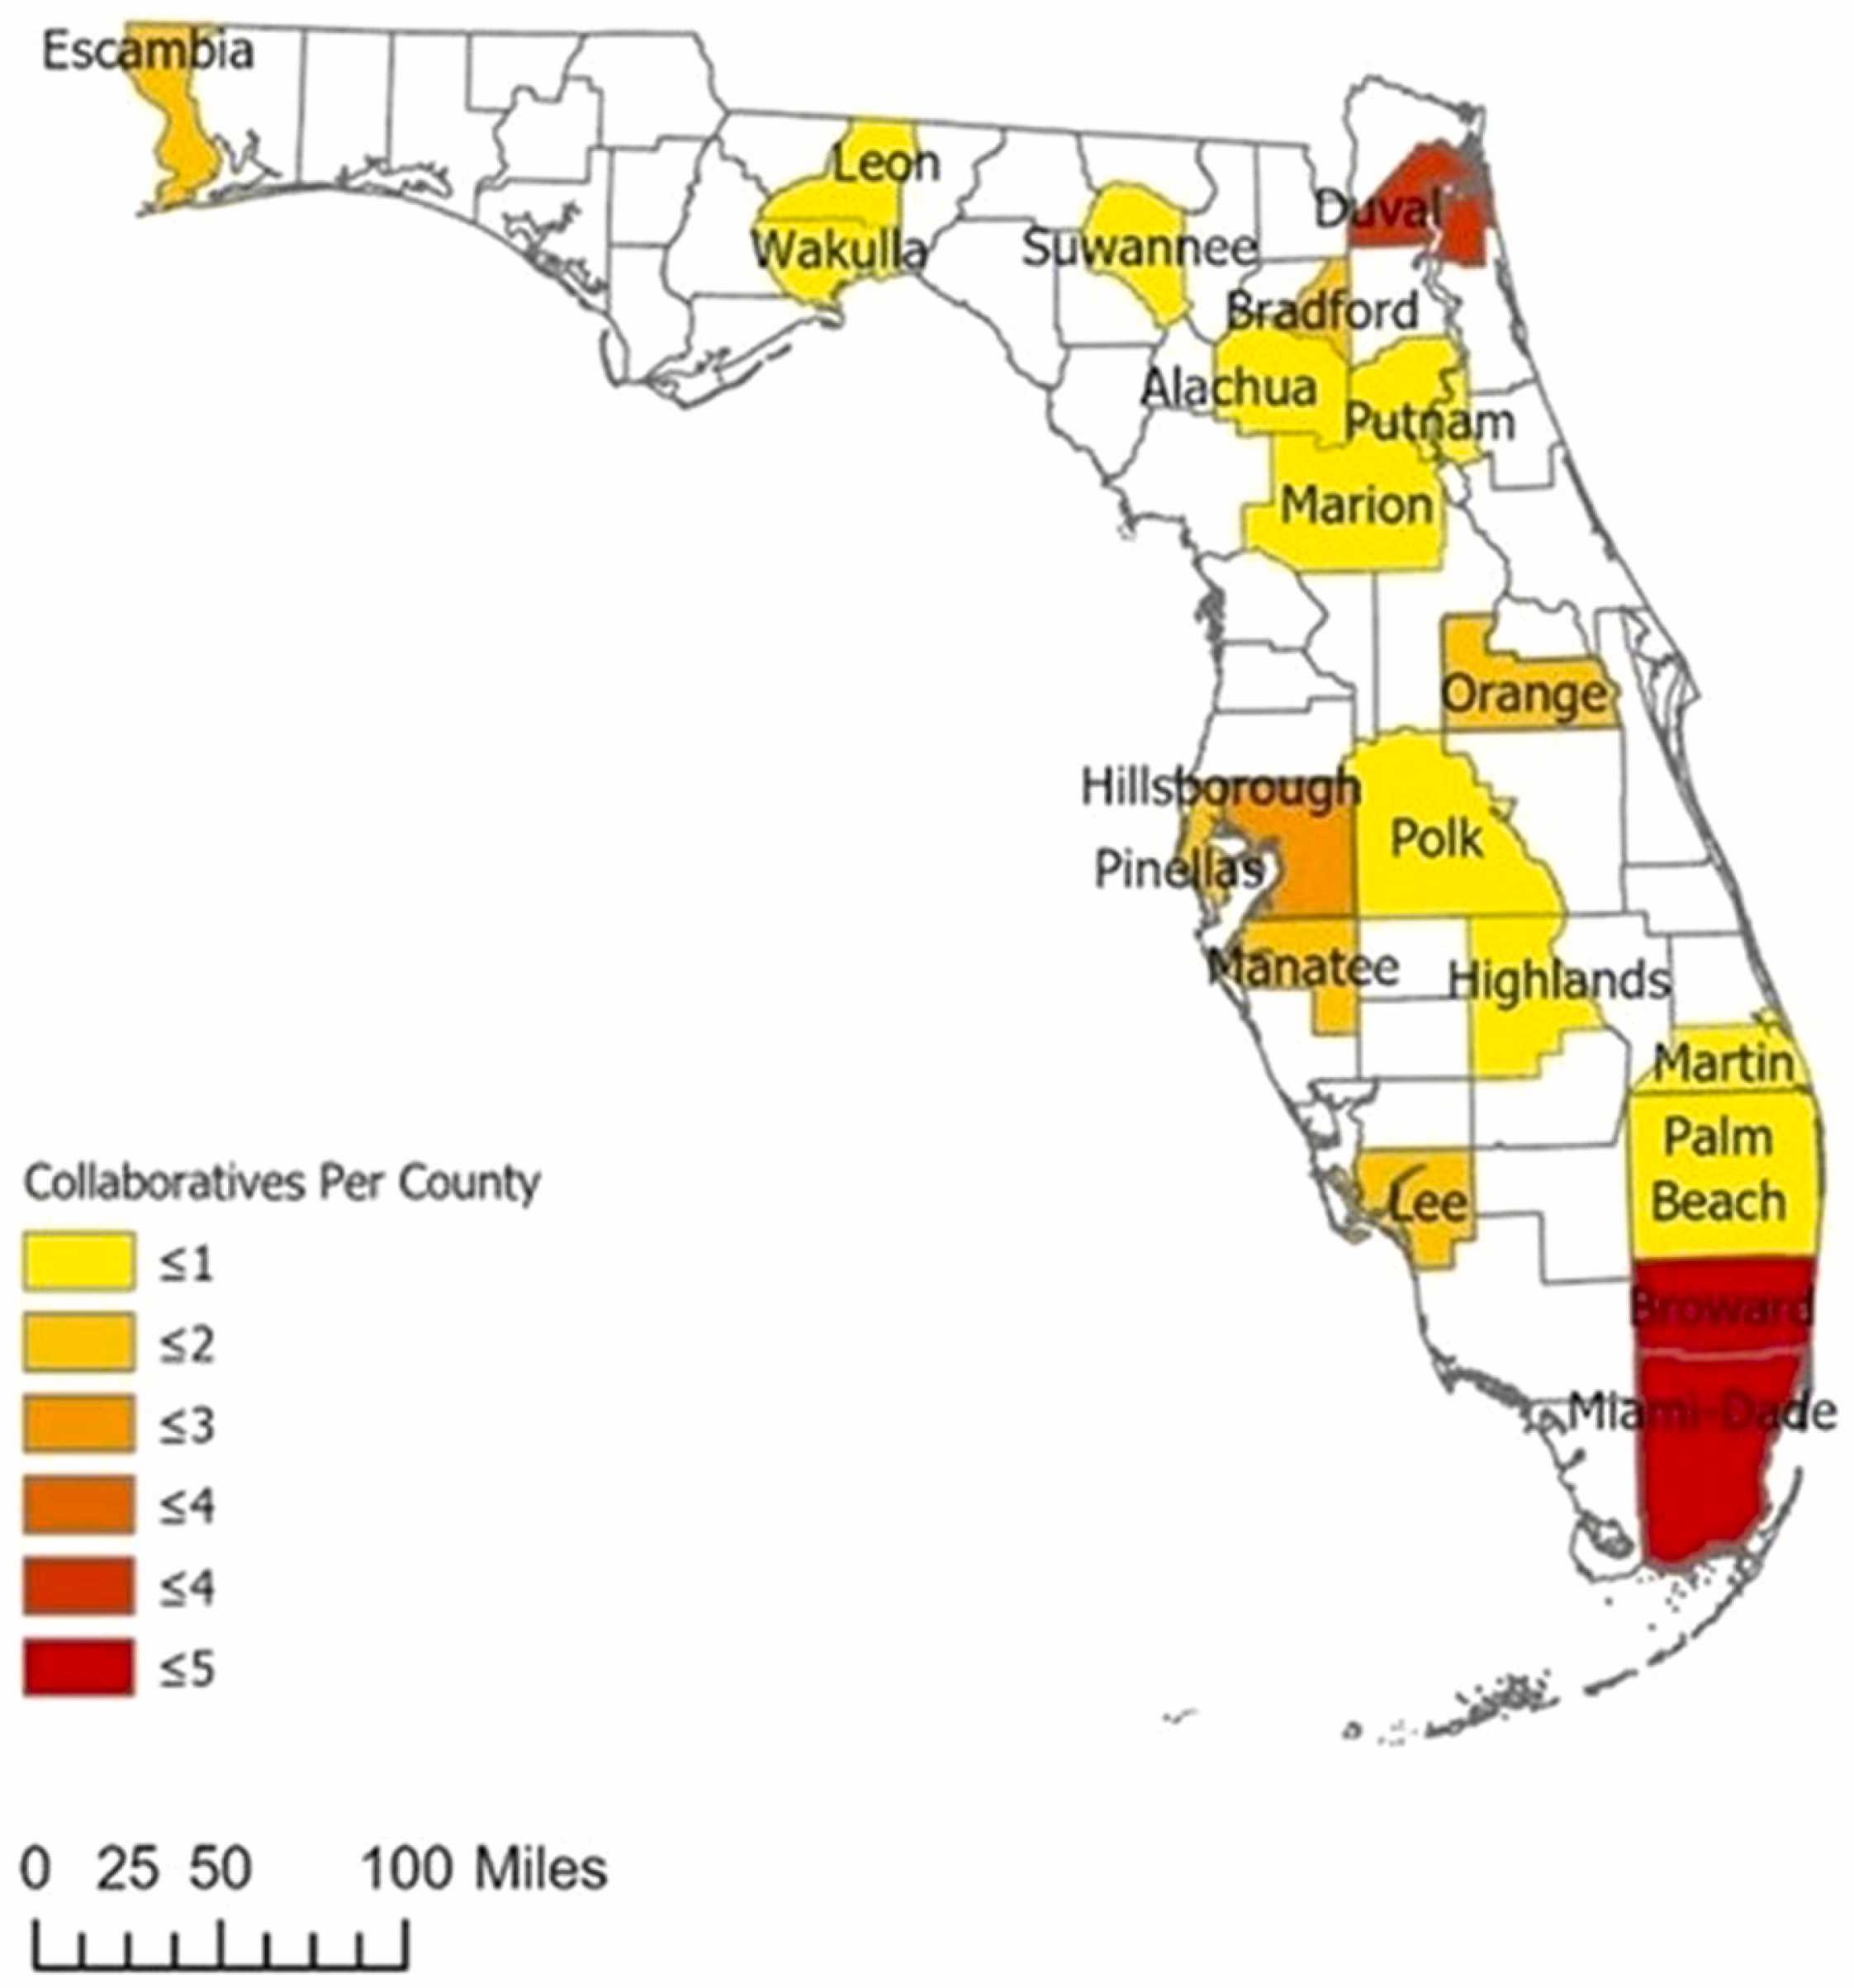
ABSTRACT: Interorganizational coalitions or collaboratives in healthcare are essential to address the health challenges of local communities, particularly during crises such as the Covid-19 pandemic. However, few studies use large-scale data to systematically assess the network structure of these collaboratives and understand their potential to be resilient or fragment in the face of structural changes. This paper analyzes data collected in 2009–2017 about 817 organizations (nodes) in 42 healthcare collaboratives (networks) throughout Florida, the third-largest U.S. state by population, including information about interorganizational ties and organizations’ resource contributions to their coalitions. Social network methods are used to characterize the resilience of these collaboratives, including identification of key players through various centrality metrics, analyses of fragmentation centrality and core/periphery structure, and Exponential Random Graph Models to examine how resource contributions facilitate interorganizational ties. Results show that the most significant resource contributions are made by key players identified through fragmentation centrality and by members of the network core. Departure or removal of these organizations would both strongly disrupt network structure and sever essential resource contributions, undermining the overall resilience of a collaborative. Furthermore, one-third of collaboratives are highly susceptible to disruption if any fragmentation-central organization is removed. More fragmented networks are also associated with poorer health-system outcomes in domains such as education, health policy, and services. ERGMs reveal that two types of resource contributions – community connections and in-kind resource sharing – are especially important to facilitate the formation of interorganizational ties in these coalitions.

Vision-based movement recognition reveals badminton player footwork using deep learning and binocular positioning


New article first published online: Heliyon

ABSTRACT: Coordinating dynamic interceptive actions in sports like badminton requires skilled performance in getting the racket into the right place at the right time. For this reason, the strategic movement and placement of one’s feet, or footwork, is an important part of competitive performance. Developing an automated, efficient, and economical method to record individual movement characteristics of players is critical and can benefit athletes and motor control specialists. Here, we propose new methods for recording data on the footwork of individual badminton players, in which deep learning is used to obtain image coordinates (2D) of their shoes and binocular positioning to reconstruct the 3D coordinates of the shoes. Results show that the final positioning accuracy is 74.7%. Using the proposed methods, we revealed inter-individual adaptations in the footwork of several participants during competitive performance. The data provided insights on how individual participants coordinated footwork to intercept the projectile, by varying the distance traveled on court and jump height. Compared with visual observations by biomechanists and motor control specialists, the proposed methods can obtain quantitative data, provide analysis and evaluation of each participant’s performance, revealing personal characteristics that could be targeted to shape the individualized training programs of players to refine their badminton footwork.

Creating grocery delivery hubs for food deserts at local convenience stores via spatial and temporal consolidation


New article first published online: Socio-Economic Planning Sciences

ABSTRACT: For many socioeconomically disadvantaged customers living in food deserts, the high costs and minimum order size requirements make attended grocery deliveries financially non-viable, although it has a potential to provide healthy foods to the food insecure population. This paper proposes consolidating customer orders and delivering to a neighborhood convenience store instead of home delivery. We employ an optimization framework involving the minimum cost set covering and the capacitated vehicle routing problems. Our experimental studies in three counties in the U.S. suggest that by spatial and temporal consolidation of orders, the deliverer can remove minimum order-size requirements and reduce the delivery costs, depending on various factors, compared to attended home-delivery. We find the number and size of time windows for home delivery to be the most important factor in achieving temporal consolidation benefits. Other significant factors in achieving spatial consolidation include the capacity of delivery vehicles, the number of depots, and the number of customer orders. We also find that the number of partner convenience stores and the walkable distance parameter of the model have a significant impact on the number of accepted orders, i.e., the service level provided by the deliverer. The findings of this study imply consolidated grocery delivery as a viable solution to improve fresh food access in food deserts. In light of the recent global pandemic and its exacerbating effects on food insecurity, the innovative solution proposed in this paper is even more relevant and timely.

The unequal commuting efficiency: A visual analytics approach


New article first published online: Journal of Transport Geography

ABSTRACT: Excess commuting measures commuting efficiency by comparing the actual commute with minimum commute for a given urban form (Hu and Li, 2021). Despite recent methodological advances, research gaps still exist. Calculating the minimum commute requires an optimization process of swapping residences/jobs among workers (White, 1988), and many commuter disaggregation approaches have been proposed for more meaningful estimates. This includes the disaggregation by occupation type, income, age, and other socioeconomic characteristics or travel behaviors (e.g., Horner et al., 2015 and the references therein; Schleith et al., 2016; Hu and Li, 2021). Nevertheless, most of these disaggregation analyses are only focused on a single socioeconomic class, which alone could be ineffective to capture the complexity of individuals’ residential (and employment) location choices. Another gap is about the resulting statistic and its demonstration. As a global indicator, excess commuting is largely reported as a single statistic concerning system-wide commuting efficiency, thus failing to capture and visualize spatial patterns. This research aims to fill these gaps. Specifically, we stratify commuters into distinct subgroups by residential neighborhood types using multiple socioeconomic variables related to residential and employment characteristics and then measure excess commuting across subgroups. Moreover, we create and geovisualize commuting networks associated with the actual, optimal, and excess commuter flow patterns to better reveal the spatial interaction patterns between locations and the disparities across commuter subgroups.

The unequal commute: Comparing commuting patterns across income and racial worker subgroups


New article first published online: Environment and Planning A: Economy and Space

ABSTRACT: The spatial dimension of the journey-to-work has important implications for land use and development policymaking and has been widely studied. One thrust of this research is concerned with the disaggregation of workers into subgroups for understanding disparities in commute. Most of these studies, however, were limited to the disaggregation by single socioeconomic class. Hence, this research aims to examine commuting disparities across commuter subgroups stratified by two socioeconomic variables—income and race—using a visual analytics approach. By applying the doubly constrained spatial interaction model to the 2014 Longitudinal Employer-Household Dynamics data, this research first synthesizes commuting flows for Downtown Houston workers across income-race subgroups at the tract level in Harris County, Texas, USA. It then uses bivariate choropleth mapping to visualize the spatial distributions of major Downtown Houston commuter neighborhoods by income-race classes, and significant commuting disparities are identified across income-race subgroups. The results highlight the importance of considering income and race simultaneously for commuting research. The visualization could help policymakers clearly identify the unequal commute across worker subgroups and inform policymaking.

Predictors of hurricane evacuation decisions: A meta-analysis

New article first published online: Journal of Environmental Psychology

ABSTRACT: We systematically review and meta-analyze quantitative prediction models for hurricane evacuation decisions. Drawing on data from 33 prediction models and 29,873 households, we estimate distributions of effects on evacuation decisions for 25 predictors. Mobile home occupancy, evacuation orders, and having an evacuation plan showed the largest positive effects on evacuation, whereas increased age and Black race showed the largest negative effects. These results highlight the importance of both social-economic-structural factors and government action, such as evacuation orders, for enabling evacuation behaviors. Moderator analyses showed that models built using real-hurricane decisions showed larger effects than models of hypothetical decisions, especially for the strongest predictors. Additionally, models in Florida had more consistent results than for other U.S. states, and models with a larger number of covariates showed smaller effect sizes than models with fewer covariates. Importantly, our study improves methodologically and inferentially over previous reviews of this literature (Preprint and supplemental materials are available at https://psyarxiv.com/d5ktm).

Modeling and Analysis of Excess Commuting with Trip Chains


New article first published online: Annals of the American Association of Geographers; DOI: 10.1080/24694452.2020.1835461

ABSTRACT: Commuting, like other types of human travel, is complex in nature, such as trip-chaining behavior involving making stops of multiple purposes between two anchors. According to the 2001 National Household Travel Survey, about half of weekday U.S. workers made a stop during their commute. In excess commuting studies that examine a region’s overall commuting efficiency, commuting is, however, simplified as nonstop travel from homes to jobs. This research fills this gap by proposing a trip-chaining-based model to integrate trip-chaining behavior into excess commuting. Based on a case study of the Tampa Bay region of Florida, this research finds that traditional excess commuting studies underestimate both actual and optimal commute and overestimate excess commuting. For chained commuting trips alone, for example, the mean minimum commute time is increased by 70 percent from 5.48 minutes to 9.32 minutes after trip-chaining is accounted for. The gaps are found to vary across trip-chaining types by a disaggregate analysis by types of chain activities. Hence, policymakers and planners are cautioned with regards to omitting trip-chaining behavior in making urban transportation and land use policies. In addition, the proposed model can be adopted to study the efficiency of nonwork travel.

Read the full publication at Annals of the American Association of Geographers

Read the preprint pdf at ResearchGate

“Perception bias”: Deciphering a mismatch between urban crime and perception of safety


New article first published online: Landscape and Urban Planning; DOI: 10.1016/j.landurbplan.2020.104003

ABSTRACT: Crime and perception of safety are two intertwined concepts affecting the quality of life and the economic development of a society. However, few studies have quantitatively examined the difference between the two due to the lack of granular data documenting public perceptions in a given geographic context. Here, by applying a pre-trained scene understanding algorithm, we infer the perception of safety score of streetscapes for census block groups in the city of Houston using a large number of Google Street View images. Then, using this inferred perception of safety, we create “perception bias” categories for each census block group. These categories capture the level of mismatch between people’s visually perceived safety and the actual crime rates. This measure provides scalable guidance in deciphering the relationship between the built environment and crime. Finally, we construct a series of models to examine the “perception bias” with static and dynamic urban factors, including socioeconomic features (e.g., unemployment rate and ethnic compositions), urban diversity (e.g., number and diversity of Points of Interest), and urban livelihood (i.e., hourly count of visitors). Analytical and numerical results suggest that the association between characteristics of urban space and “perception bias” over crime could be paradoxical. On the one hand, neighborhoods with a higher volume of day-time visitors appear more likely to be safer than it looks (low crime rate and low safety score). On the other hand, those with a higher volume of night-time visitors are likely to be more dangerous than it looks (high crime rate). The findings add further knowledge to the long-recognized relationship between built environment and crime as well as highlight the perception of safety in cities, which in turn enhances our capacity to design urban management strategies that prevent the emergence of extreme “perception bias”.

Read the full publication at Landscape and Urban Planning