
New article first published online: Journal of Transport Geography
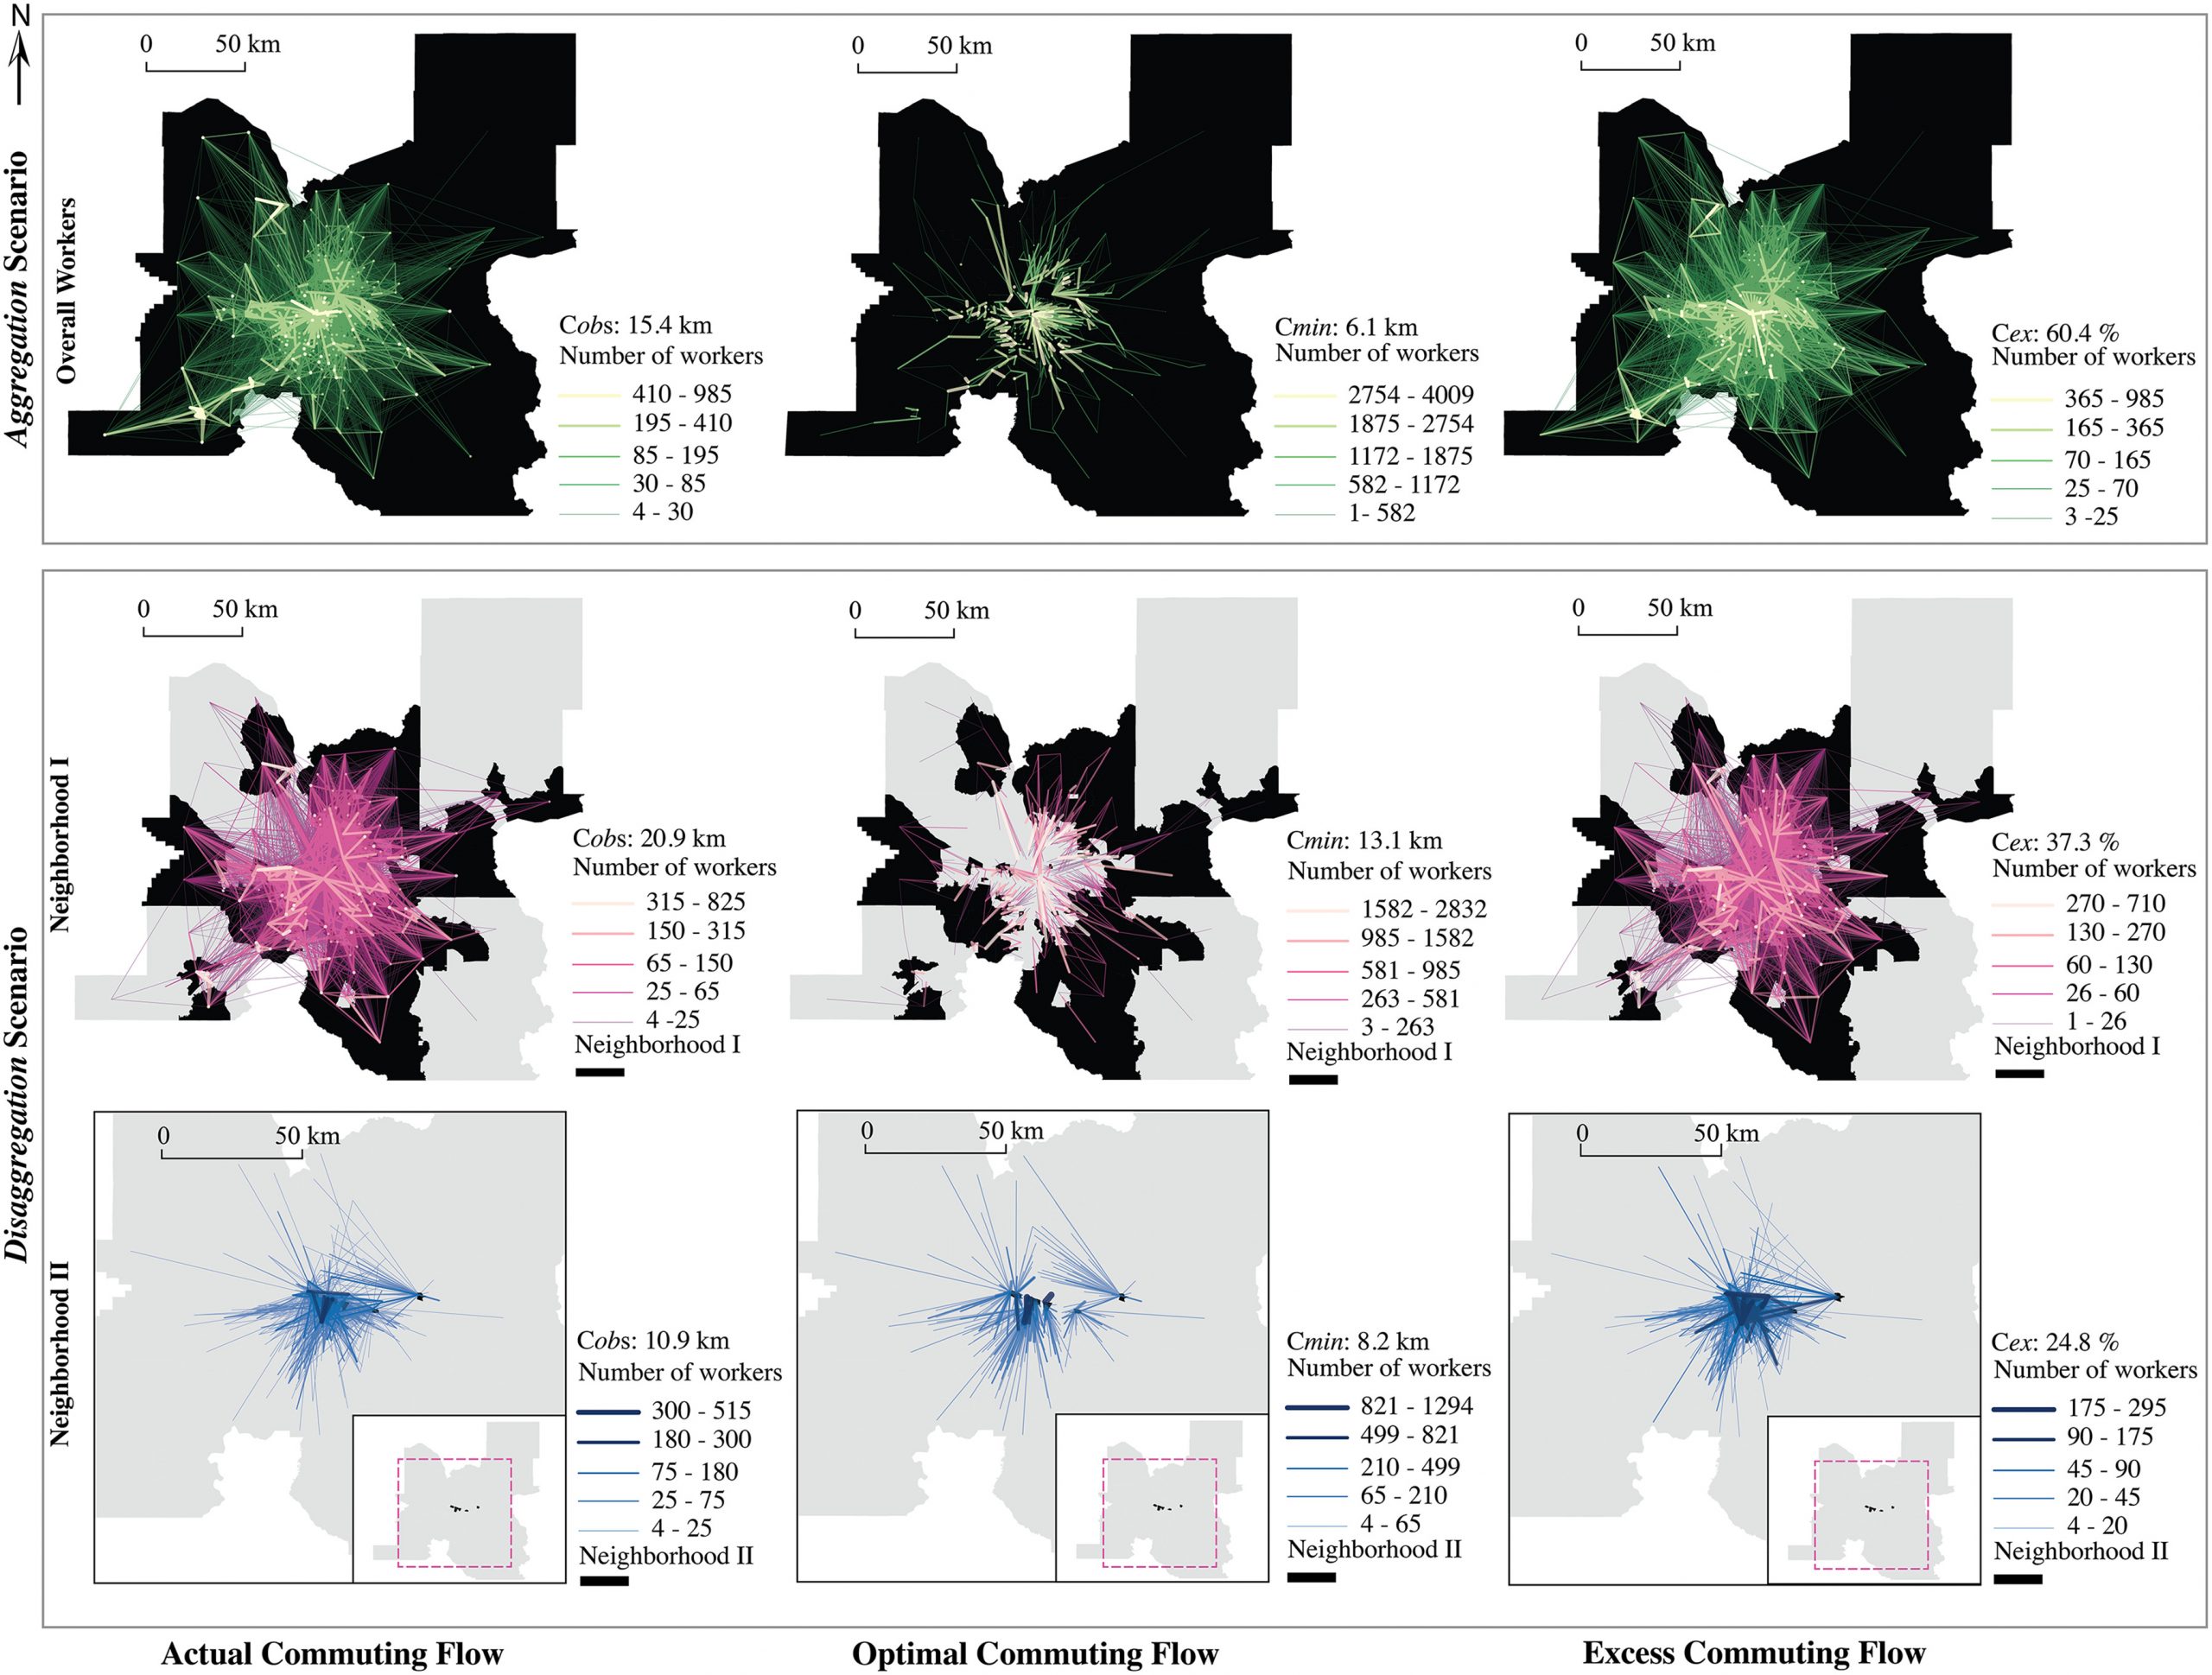
ABSTRACT: Excess commuting measures commuting efficiency by comparing the actual commute with minimum commute for a given urban form (Hu and Li, 2021). Despite recent methodological advances, research gaps still exist. Calculating the minimum commute requires an optimization process of swapping residences/jobs among workers (White, 1988), and many commuter disaggregation approaches have been proposed for more meaningful estimates. This includes the disaggregation by occupation type, income, age, and other socioeconomic characteristics or travel behaviors (e.g., Horner et al., 2015 and the references therein; Schleith et al., 2016; Hu and Li, 2021). Nevertheless, most of these disaggregation analyses are only focused on a single socioeconomic class, which alone could be ineffective to capture the complexity of individuals’ residential (and employment) location choices. Another gap is about the resulting statistic and its demonstration. As a global indicator, excess commuting is largely reported as a single statistic concerning system-wide commuting efficiency, thus failing to capture and visualize spatial patterns. This research aims to fill these gaps. Specifically, we stratify commuters into distinct subgroups by residential neighborhood types using multiple socioeconomic variables related to residential and employment characteristics and then measure excess commuting across subgroups. Moreover, we create and geovisualize commuting networks associated with the actual, optimal, and excess commuter flow patterns to better reveal the spatial interaction patterns between locations and the disparities across commuter subgroups.
