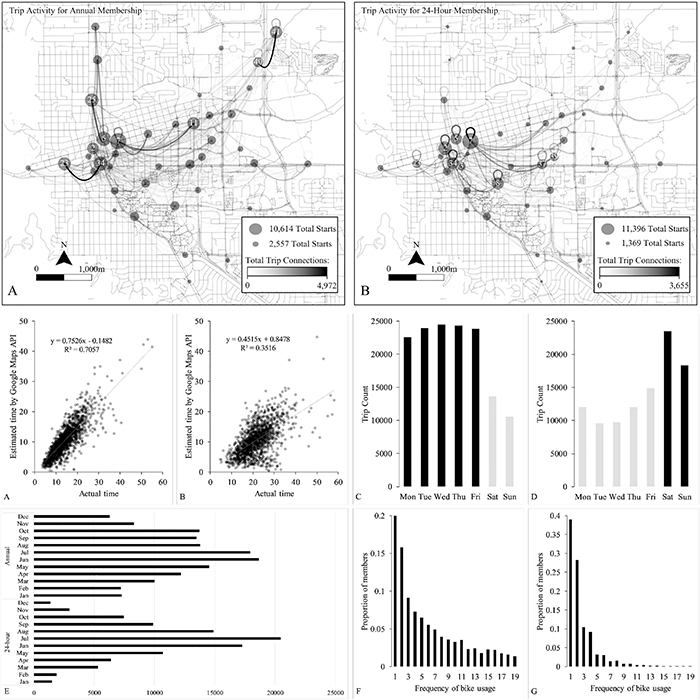
Examining and optimizing the BCycle bike-sharing system – A pilot study in Colorado, US


New article first published online: Applied Energy; DOI: 10.1016/j.apenergy.2019.04.007

ABSTRACT: Many cities around the world have integrated bike-sharing programs into their public transit systems to promise sustainable, affordable transportation and reduce environmental pollution in urban areas. Investigating the usage patterns of shared bikes is of key importance to understand cyclist’s behaviors and subsequently optimize bike-sharing programs. Based on the historical trip records of bike users and station empty/full status data, this paper evaluated and optimized the bike-sharing program BCycle in the city of Boulder, Colorado, the United States, using a combination of different methods including the Potential Path Area (PPA) and the Capacitated Maximal Covering Location Problem (CMCLP). Results showed significantly different usage patterns between membership groups, revealed diverse imbalance patterns of bike supply and demand across stations in the city and provided three system upgrading strategies about maximizing the service coverage. This case study is committed to future energy conservation and sustainable energy systems nationwide and ultimately worldwide, by holding immerse potential to adapt the resulting optimization strategies to the cities with a similar urban context across the United States, as well as more emerging bike-sharing programs in other countries, such as China.

Read the full publication at Applied Energy

Measuring and visualizing place-based space-time job accessibility


New article first published online: Journal of Transport Geography; DOI: 10.1016/j.jtrangeo.2018.12.002

ABSTRACT: Place-based accessibility measures, such as the gravity-based model, are widely applied to study the spatial accessibility of workers to job opportunities in cities. However, gravity-based measures often suffer from three main limitations: (1) they are sensitive to the spatial configuration and scale of the units of analysis, which are not specifically designed for capturing job accessibility patterns and are often too coarse; (2) they omit the temporal dynamics of job opportunities and workers in the calculation, instead assuming that they remain stable over time; and (3) they do not lend themselves to dynamic geovisualization techniques. In this paper, a new methodological framework for measuring and visualizing place-based job accessibility in space and time is presented that overcomes these three limitations. First, discretization and dasymetric mapping approaches are used to disaggregate counts of jobs and workers over specific time intervals to a fine-scale grid. Second, Shen’s (1998) gravity-based accessibility measure is modified to account for temporal fluctuations in the spatial distributions of the supply of jobs and the demand of workers and is used to estimate hourly job accessibility at each cell. Third, a four-dimensional volumetric rendering approach is employed to integrate the hourly job access estimates into a space-time cube environment, which enables the users to interactively visualize the space-time job accessibility patterns. The integrated framework is demonstrated in the context of a case study of the Tampa Bay region of Florida. The findings demonstrate the value of the proposed methodology in job accessibility analysis and the policy-making process.

Read the full publication at Journal of Transport Geography

Read the preprint pdf at ResearchGate

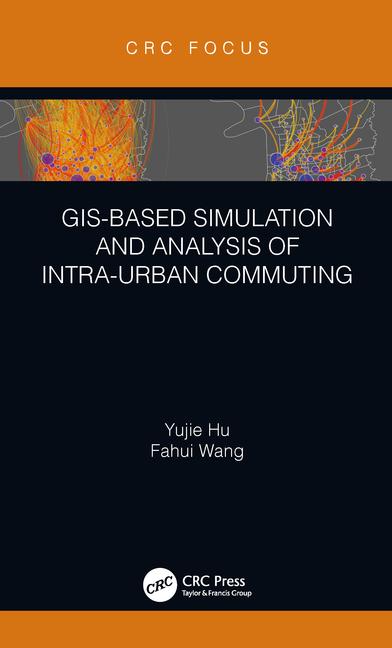
GIS-based simulation and analysis of intra-urban commuting


New book published: CRC Press; ISBN 9780367023034

Description:

Commuting, the daily link between residences and workplaces, sets up the complex interaction between the two most important land uses (residential and employment) in a city, and dictates the configuration of urban structure. In addition to prolonged time and stress for individual commuters on traffic, commuting comes with additional societal costs including elevated crash risks, worsening air quality, and louder traffic noise, etc. These issues are important to city planners, policy researchers, and decision makers.

GIS-Based Simulation and Analysis of Intra-Urban Commuting, presents GIS-based simulation, optimization and statistical approaches to measure, map, analyze, and explain commuting patterns including commuting length and efficiency. Several GIS-automated easy-to-use tools will be available, along with sample data, for readers to download and apply to their own studies.

This book recognizes that reporting errors from survey data and use of aggregated zonal data are two sources of bias in estimation of wasteful commuting, it studies the temporal trend of intraurban commuting pattern based on the most recent period newly-available 2006-2010, and it focuses on commuting, and especially wasteful commuting within US cities. It includes ready-to-download GIS-based simulation tools and sample data, and an explanation of optimization and statistical techniques of how to measure commuting, as well as presenting a methodology that can be applicable to other studies.

This book is an invaluable resource for students, researchers, and practitioners in geography, urban planning, public policy, transportation engineering, and other related disciplines.

Read the full publication at CRC Press

Download the data and programs/codes for the analyses in the book at the Downloads page

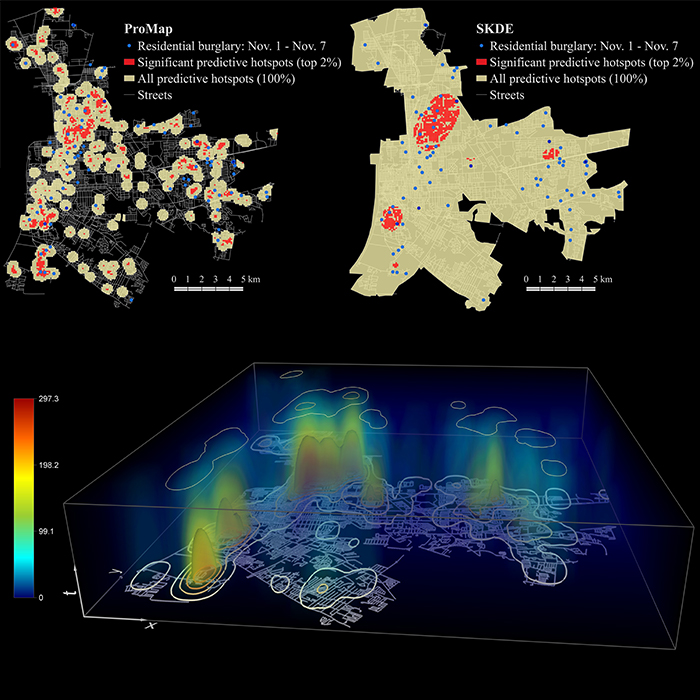
A spatio-temporal kernel density estimation framework for predictive crime hotspot mapping and evaluation


New article first published online: Applied Geography; DOI: 10.1016/j.apgeog.2018.08.001

ABSTRACT: Predictive hotspot mapping plays a critical role in hotspot policing. Existing methods such as the popular kernel density estimation (KDE) do not consider the temporal dimension of crime. Building upon recent works in related fields, this article proposes a spatio-temporal framework for predictive hotspot mapping and evaluation. Comparing to existing work in this scope, the proposed framework has four major features: (1) a spatio-temporal kernel density estimation (STKDE) method is applied to include the temporal component in predictive hotspot mapping, (2) a data-driven optimization technique, the likelihood cross-validation, is used to select the most appropriate bandwidths, (3) a statistical significance test is designed to filter out false positives in the density estimates, and (4) a new metric, the predictive accuracy index (PAI) curve, is proposed to evaluate predictive hotspots at multiple areal scales. The framework is illustrated in a case study of residential burglaries in Baton Rouge, Louisiana in 2011, and the results validate its utility.

Read the full publication at Applied Geography

Read the preprint pdf at ResearchGate

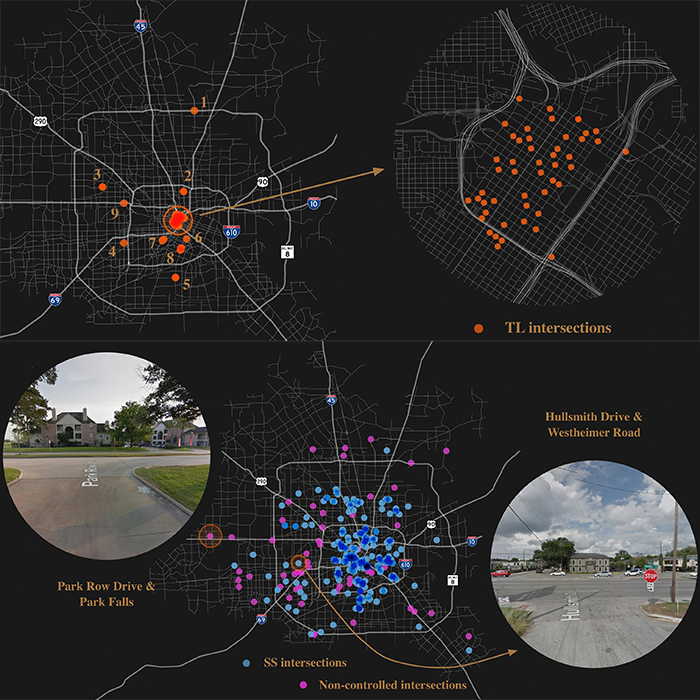
Where are the dangerous intersections for pedestrians and cyclists: A colocation-based approach


New article first published online: Transportation Research Part C: Emerging Technologies; DOI: 10.1016/j.trc.2018.07.030

ABSTRACT: Understanding the spatio-temporal road network accessibility during a hurricane evacuation—the level of ease of residents in an area in reaching evacuation destination sites through the road network—is a critical component of emergency management. While many studies have attempted to measure road accessibility (either in the scope of evacuation or beyond), few have considered both dynamic evacuation demand and characteristics of a hurricane. This study proposes a methodological framework to achieve this goal. In an interval of every six hours, the method first estimates the evacuation demand in terms of number of vehicles per household in each county subdivision (sub-county) by considering the hurricane’s wind radius and track. The closest facility analysis is then employed to model evacuees’ route choices towards the predefined evacuation destinations. The potential crowdedness index (PCI), a metric capturing the level of crowdedness of each road segment, is then computed by coupling the estimated evacuation demand and route choices. Finally, the road accessibility of each sub-county is measured by calculating the reciprocal of the sum of PCI values of corresponding roads connecting evacuees from the sub-county to the designated destinations. The method is applied to the entire state of Florida during Hurricane Irma in September 2017. Results show that I-75 and I-95 northbound have a high level of congestion, and sub-counties along the northbound I-95 suffer from the worst road accessibility. In addition, this research performs a sensitivity analysis for examining the impacts of different choices of behavioral response curves on accessibility results.

Read the full publication at Transportation Research Part C: Emerging Technologies

Read the preprint pdf at ResearchGate

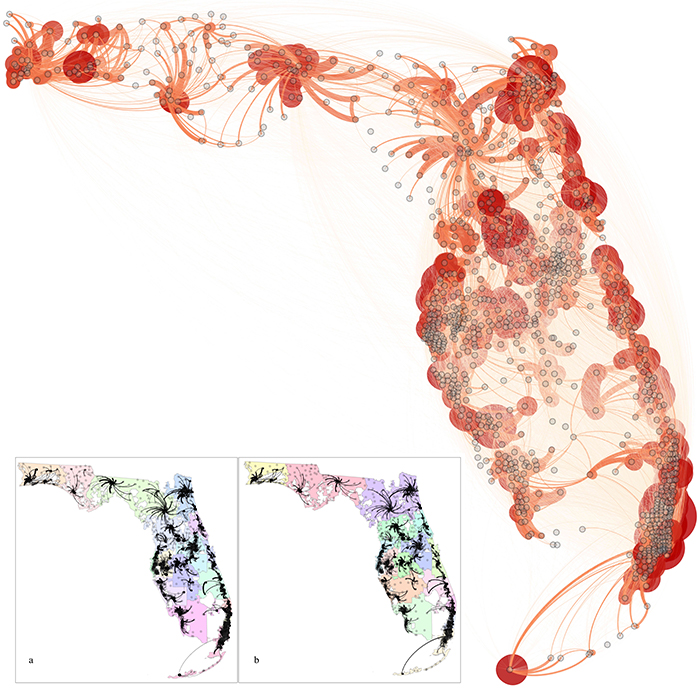
Automated delineation of hospital service areas and hospital referral regions by modularity optimization


New article first published online: Health Services Research; DOI: 10.1111/1475-6773.12616

ABSTRACT:

Objective

To develop an automated, data‐driven, and scale‐flexible method to delineate hospital service areas (HSA s) and hospital referral regions (HRR s) that are up‐to‐date, representative of all patients, and have the optimal localization of hospital visits.

Data Sources

The 2011 state inpatient database in Florida from the Healthcare Cost and Utilization Project.

Study Design

A network optimization method was used to redefine HSA s and HRR s by maximizing patient‐to‐hospital flows within each HSA /HRR while minimizing flows between them. We first constructed as many HSA s/HRR s as existing Dartmouth units in Florida, and then compared the two by various metrics. Next, we sought to derive the optimal numbers and configurations of HSA s/HRR s that best reflect the modularity of hospitalization patterns in Florida.

Principal Findings

The HSA s/HRR s by our method are favored over the Dartmouth units in balance of region size and market structure, shape, and most important, local hospitalization.

Conclusions

The new method is automated, scale‐flexible, and effective in capturing the natural structure of the health care system. It has great potential for applications in delineating other health care service areas or in larger geographic regions.

Read the full publication at Health Services Research

Read the preprint pdf at ResearchGate